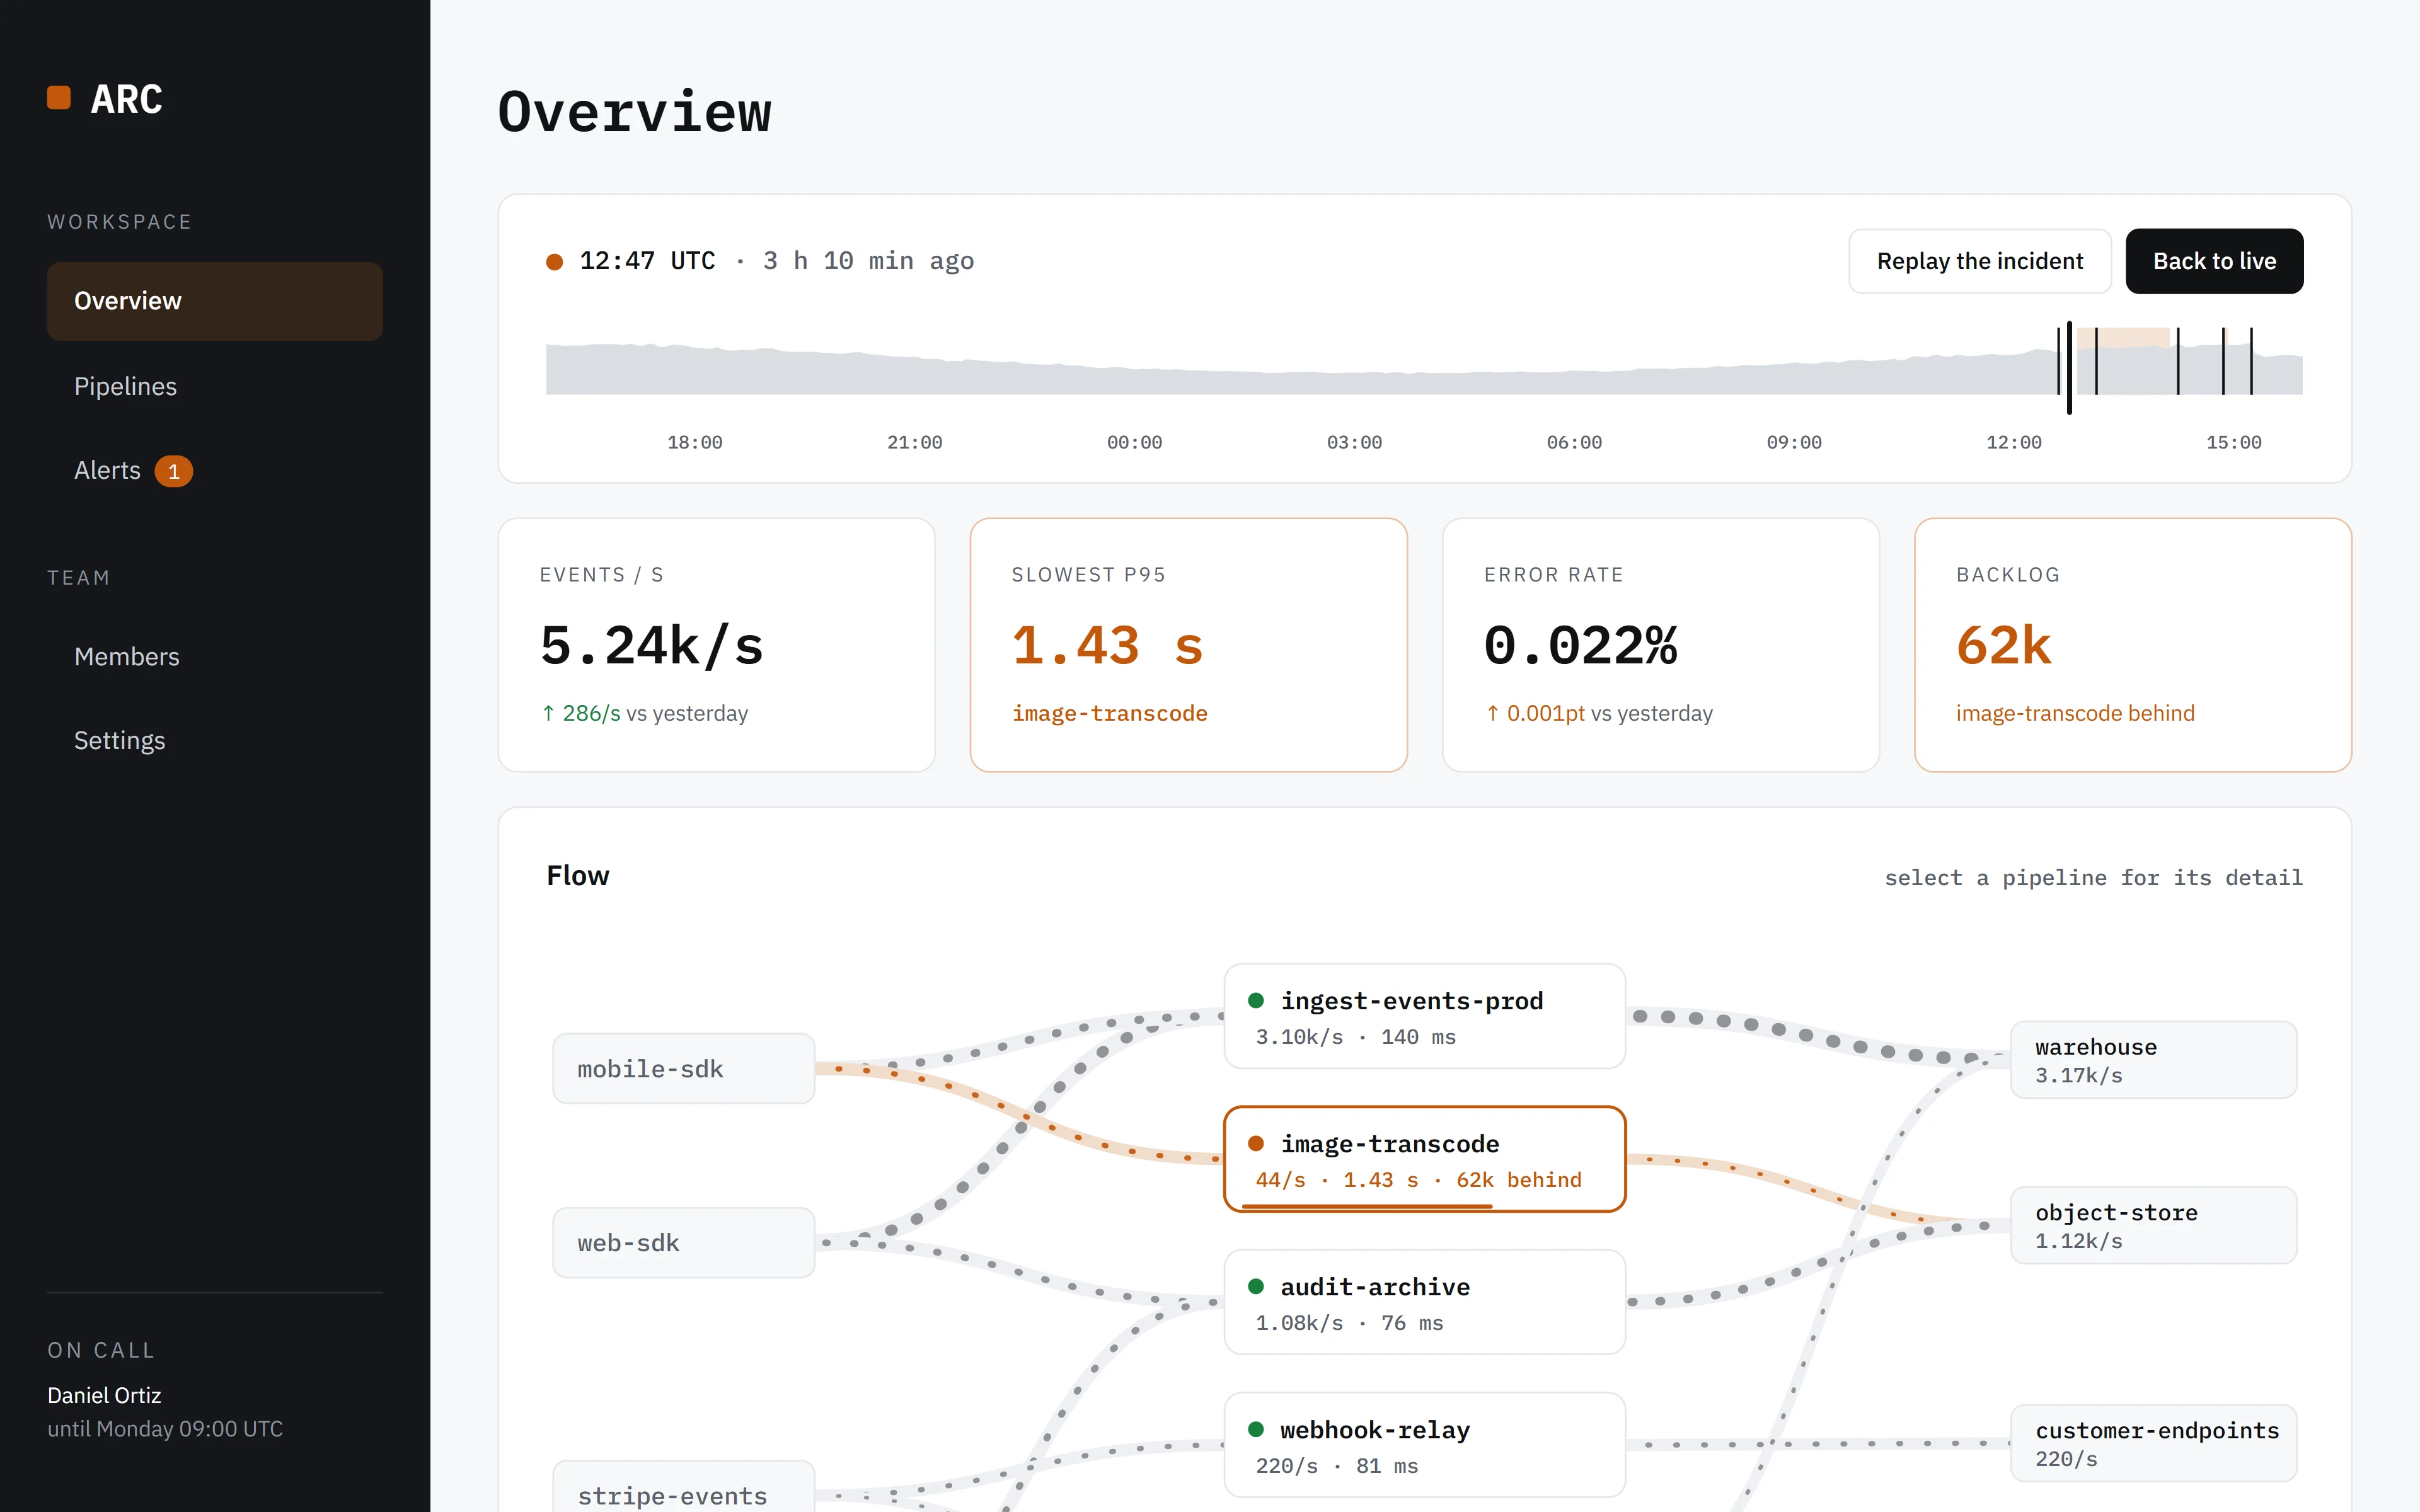
An observability dashboard for data pipelines where you can rewind any minute of the last 24 hours — and watch an incident happen, page someone, get rolled back and drain away.
Drag the strip, or press “Replay the incident”. Open the full dashboard →
Visual Direction
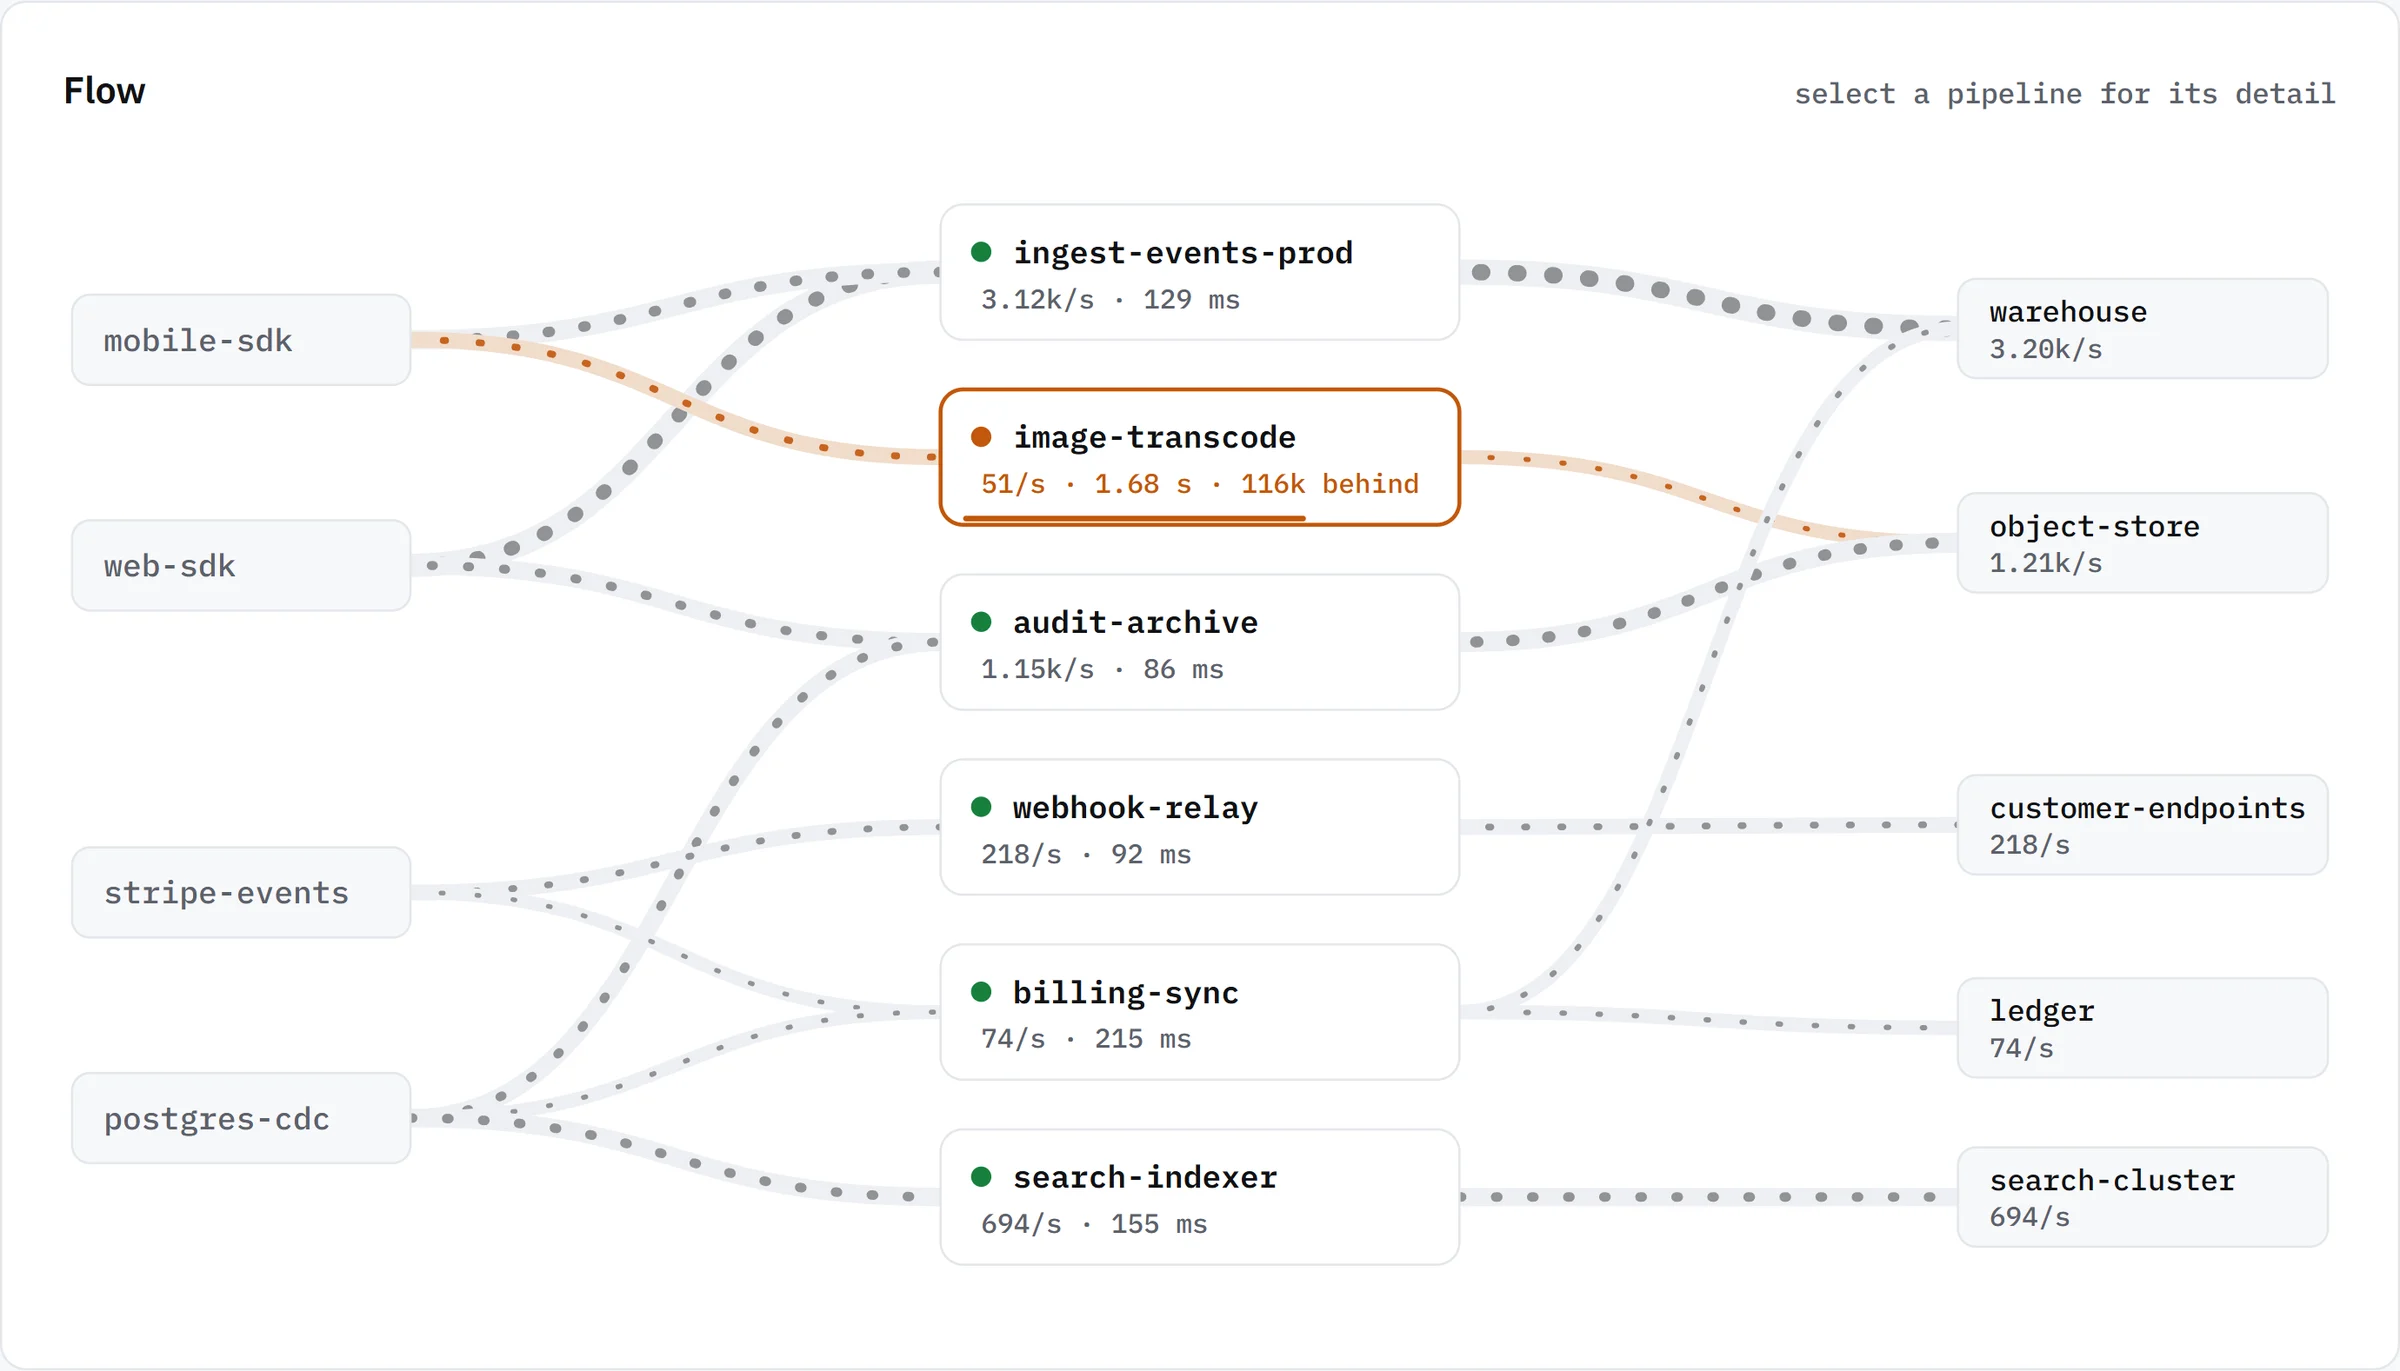
No imagery at all, by design — no photography, no 3D, no renders: the product is the picture. Everything on screen is drawn from the data: a flow map of six pipelines between their sources and destinations where line weight is volume, a 24-hour strip with the incident marked on it, and charts with yesterday dashed behind today. A working application rather than a marketing page, and nothing of the purple-gradient AI-product look.
IBM Plex Mono for every number, time, pipeline name and section heading gives the interface a technical, data-native feel and keeps figures aligned as they change; IBM Plex Sans carries labels and prose — a genuinely different pairing from any other concept here.
Typography
Palette
Cool off-white (#F7F8FA) and ink, with a warm amber (#C2570C) as the one accent — and amber only ever means trouble: a degraded pipeline, a breached threshold, a backlog. A quiet dashboard is almost colourless, so a problem is visible from across the room.
$ arc replay --at 12:51 — the flow, three hours ago
Layout Logic
A fixed sidebar and a working column, as real application architecture. The time bar sits above everything it controls: rewind it and the four numbers, the flow map, the throughput chart and the event log all move to that minute together. Selecting a pipeline opens a side panel with its throughput, p95 and backlog over the day, what it reads and writes, and a pause switch; the pipelines table shows the same minute, with a 24-hour sparkline per row.
Drag the strip — or click a chart, or any line of the event log — and the whole dashboard rewinds; events after the cursor fade, because from there they haven't happened yet. "Replay the incident" plays the afternoon's bad deploy minute by minute: latency climbs, the queue fills, the on-call engineer is paged and acknowledges, the rollback lands and the backlog replays at 130% until it has caught up. The simulation is deterministic per UTC minute and follows each region's real local time, so Singapore is busy while Virginia sleeps; pausing a pipeline holds its input, and resuming replays it.
Interaction
Demonstrates
- Dashboard UI
- Data visualisation
- Time-travel interaction
- Responsive application layout